Benchmark Verified: The five stages of Benchmark’s gigafactory satellite analysis

As the number of gigafactories being built increases,Benchmark has begun using satellite analysisto provide an additional level of insight into the ramp up of battery capacity.
Benchmark has verified 400 operations globally, 235 of which are active. With many sites nearing completion, this figure is expected to rise in the near future. As a result of this growth in the market, and the fact that existing sites generally operate significantly below their maximum capacity, the importance of transparency and accuracy increases.
Benchmark began tracking the development of gigafactories in 2015 and in 2023 established the use of Geographic Information Systems (GIS) to verify the status of these battery plants using satellite imagery.
This information is tracked and published through Benchmark Verified, which provides additional evidence-backed insight to Benchmark’sGigafactory Assessment, as new battery companies enter the market and existing producers scale rapidly.
Since launching in October, Benchmark’s analysts have verified 93.6% of Tier 1 pipeline capacity. Sites still in the planning phase are yet to be verified.
Below are the five stage process used by Benchmark Verified to assess each gigafactory’s stage of development:
Stage 1: Identify and verify location
The first stage of gigafactory satellite analysis is confirming the location.
To do this, Benchmark’s GIS division uses Benchmark’s proprietary data, insights from our sector analysts, and preliminary satellite imagery to identify and corroborate the location of each factory. Benchmark is currently tracking over 400 gigafactories in production or development.
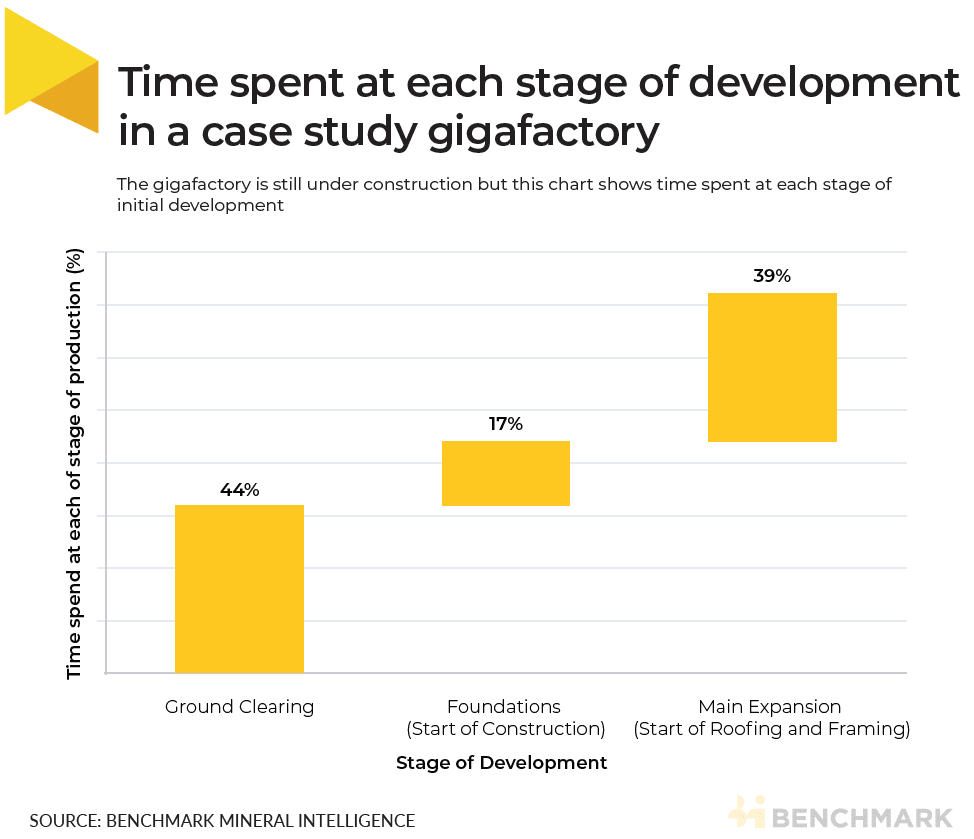
Stage 2: Establish construction timeline
For sites still under construction, Benchmark uses proprietary in-house analysis to identify completion of key development milestones and produce a timeline of site activity.
Stage 3: Analyse active sites
Using high-resolution satellite imagery, Benchmark analyses active sites to confirm site footprint as well as signs of production activity. Via continued rolling analysis this insight is used alongside our direct interaction with supply chain players to add further evidence to Benchmark’s production data.
Stage 4: Review and assign
Following a final review and based on the analysis in the previous sections Benchmark’s GIS analysts will then categorise these gigafactories into two groups: “Verified Active Capacity,” where external site activity is complete suggesting progress towards cell production, or “Verified Capacity Under Construction,” with visible evidence of construction.
Stage 5: Publish to database
The status of each site is updated monthly and is accessible to subscribers both in the report and on the Benchmark website. Benchmark Verified ensures that Benchmark’s capacity forecast in the Benchmark Gigafactory Assessment remains the most accurate and reliable in the market.
Case Study: LGES Chem expanding capacity in Michigan, US
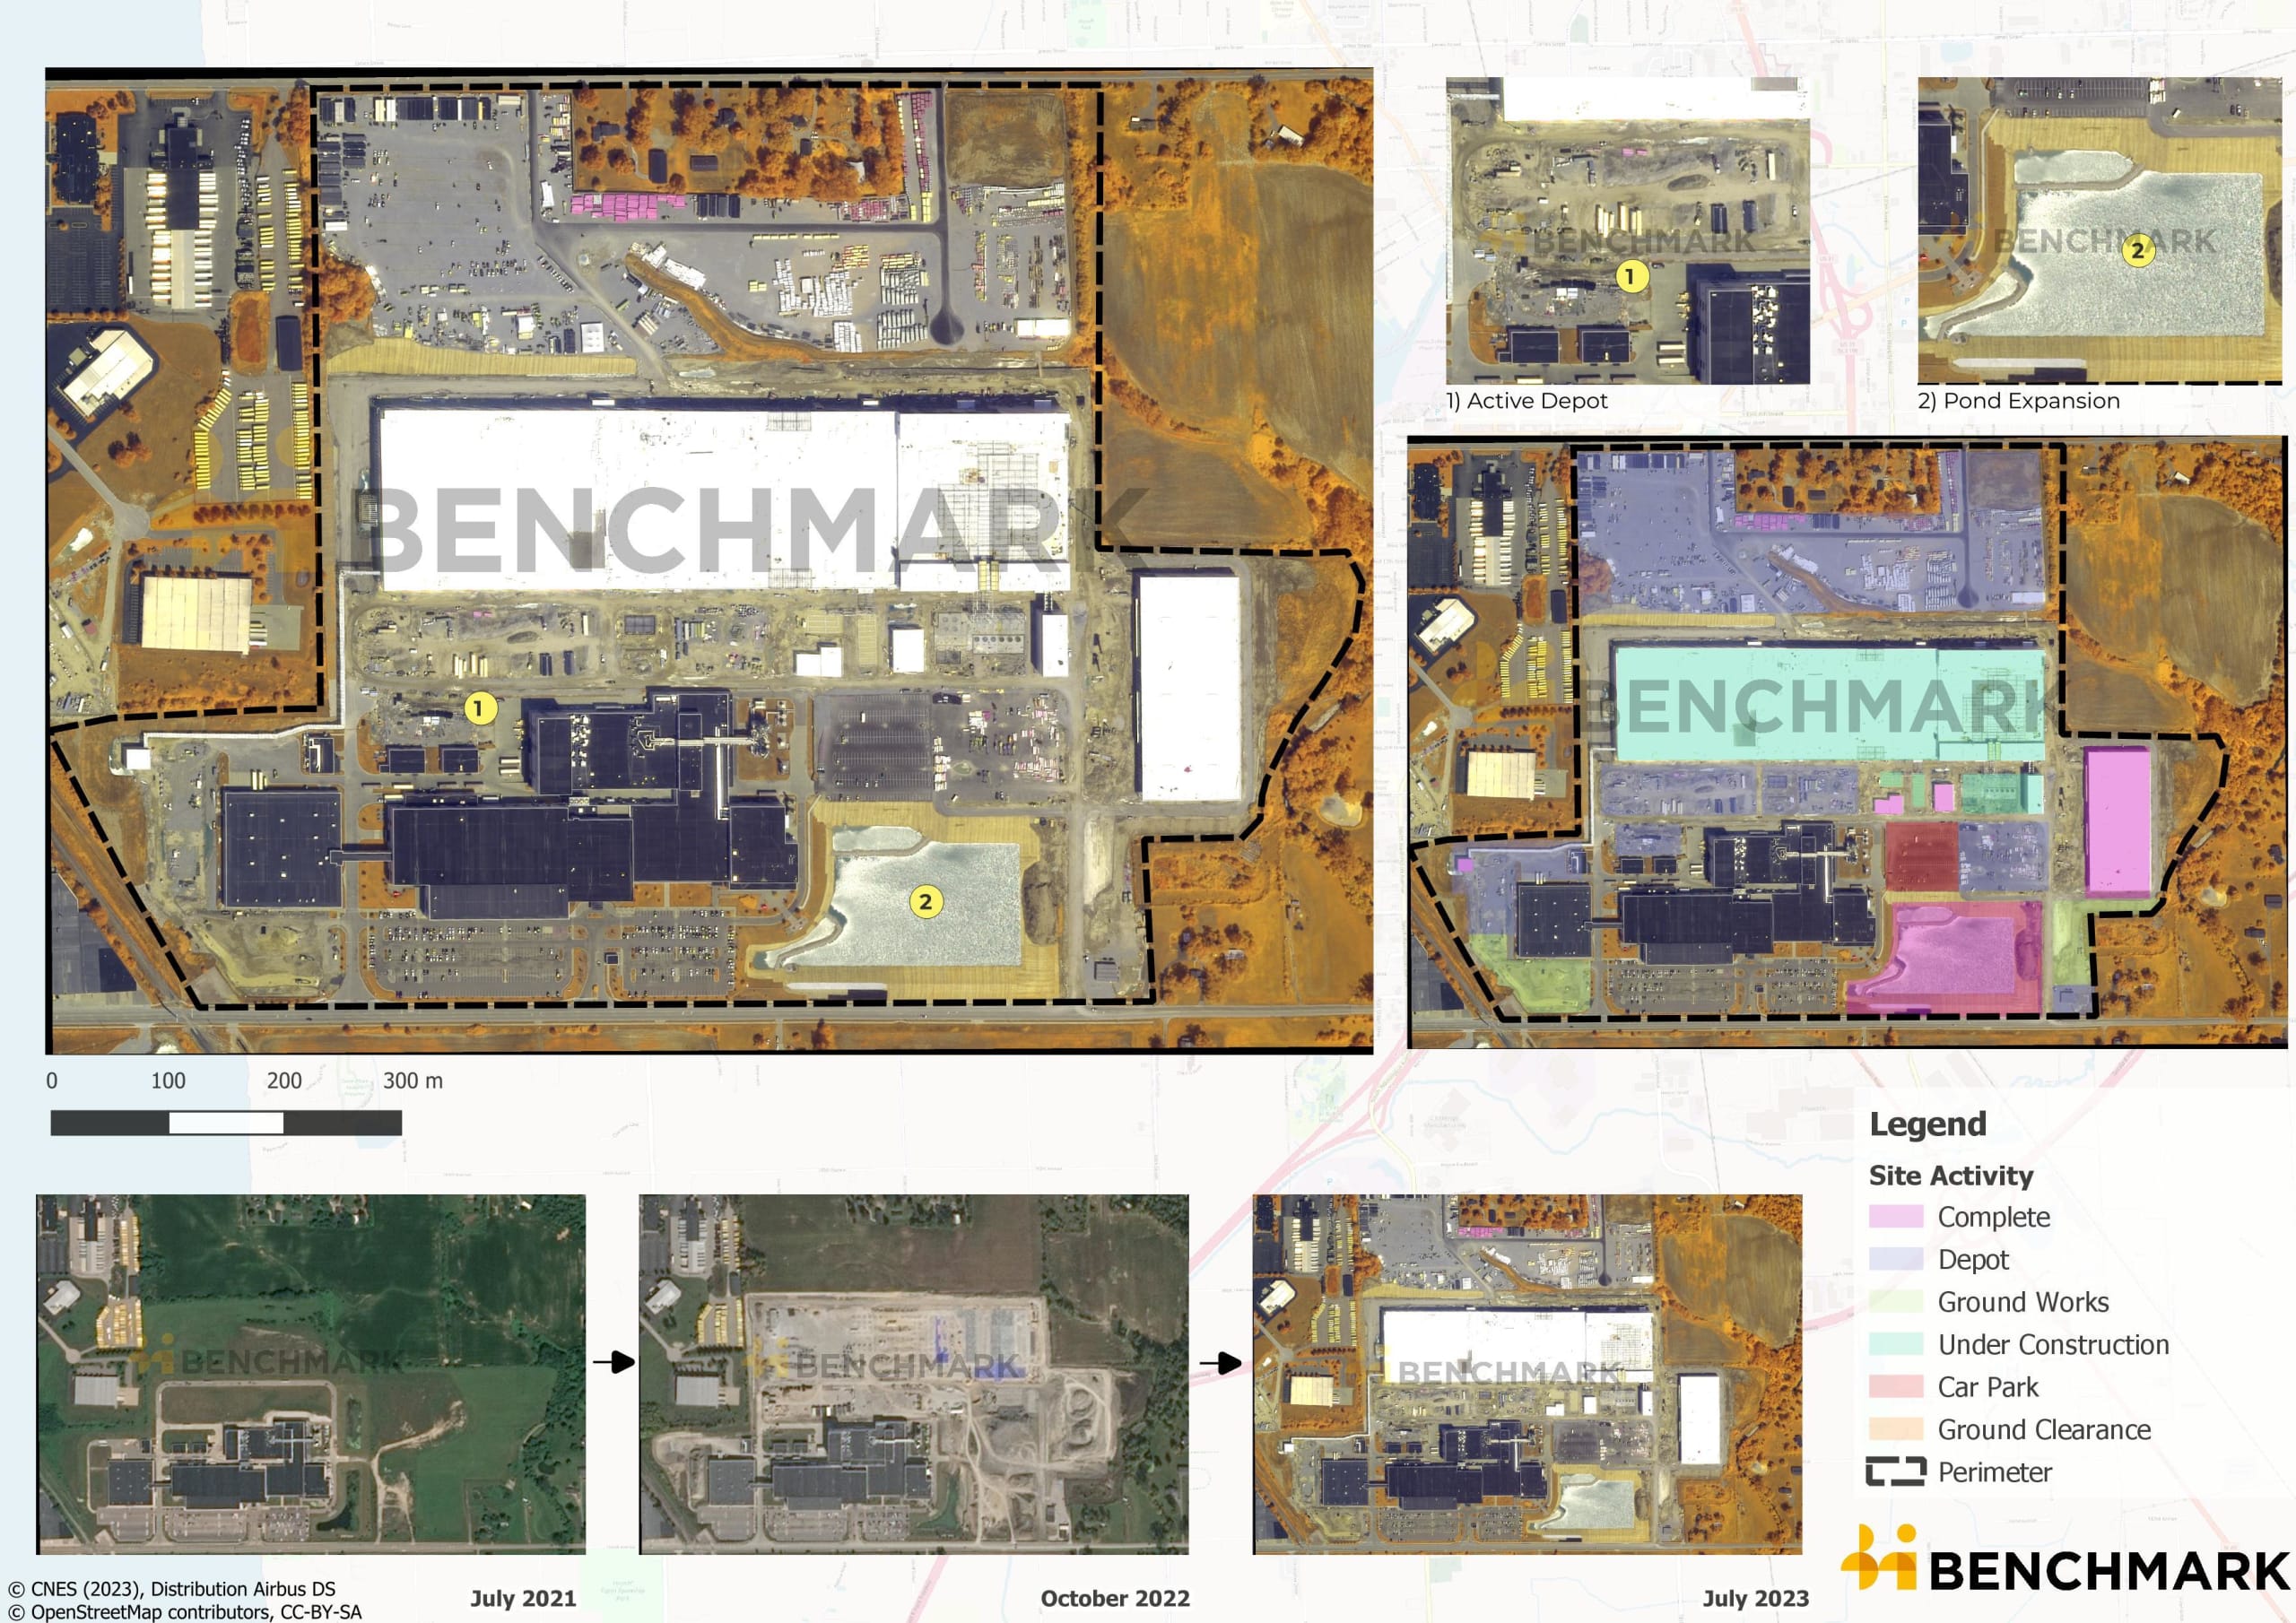
In early October, LG Energy Solution (LGES), a South Korean Tier 1 battery cell manufacturer, announced a KRW 4 trillion (US$3bn) investment in expanding its gigafactory located in Holland, Michigan, US. The intention was to increase capacity at the plant to 40 gigawatt-hours (GWh) by 2025. This development follows the company’s earlier announcement in March 2022, to increase capacity to 26 GWh, scheduled to be operational by 2024.
The expansion plan was prompted by a substantial long-term supply agreement with Toyota, securing an annual order for 20 GWh of NCMA cells. The expanded production lines established as part of this initiative will be dedicated to the production of pouch NCM cells for the Toyota assembly plant in Georgetown, Kentucky, US.
Benchmark has been able to assess and verify construction activities at the plant using geospatial analysis. Using satellite imagery showing the laying of foundations and earth works, Benchmark confirmed the onset of construction in June 2022.
The increase in capacity at the production base is nearing completion, with the majority of the facility roof installed as of July 2023. Growth in adjacent depot buildings, employee car parking facilities, and logistical infrastructure provides additional evidence.
This expansion brings LGES’ global pipeline capacity to 710.2 GWh through to 2030, according to the Benchmark Gigafactory Assessment.
Benchmark’s new remote sensing service provides accurate and transparent insight into downstream projects, backed by satellite imagery.
This analysis is included every month in our Gigafactory Assessment.
If you interested in to learn more about Benchmark’s Gigafactory Assessment and view a sample report, please register your interest here:
 >
>  >
>  >
>  >
>  >
>  >
>  >
>  >
>