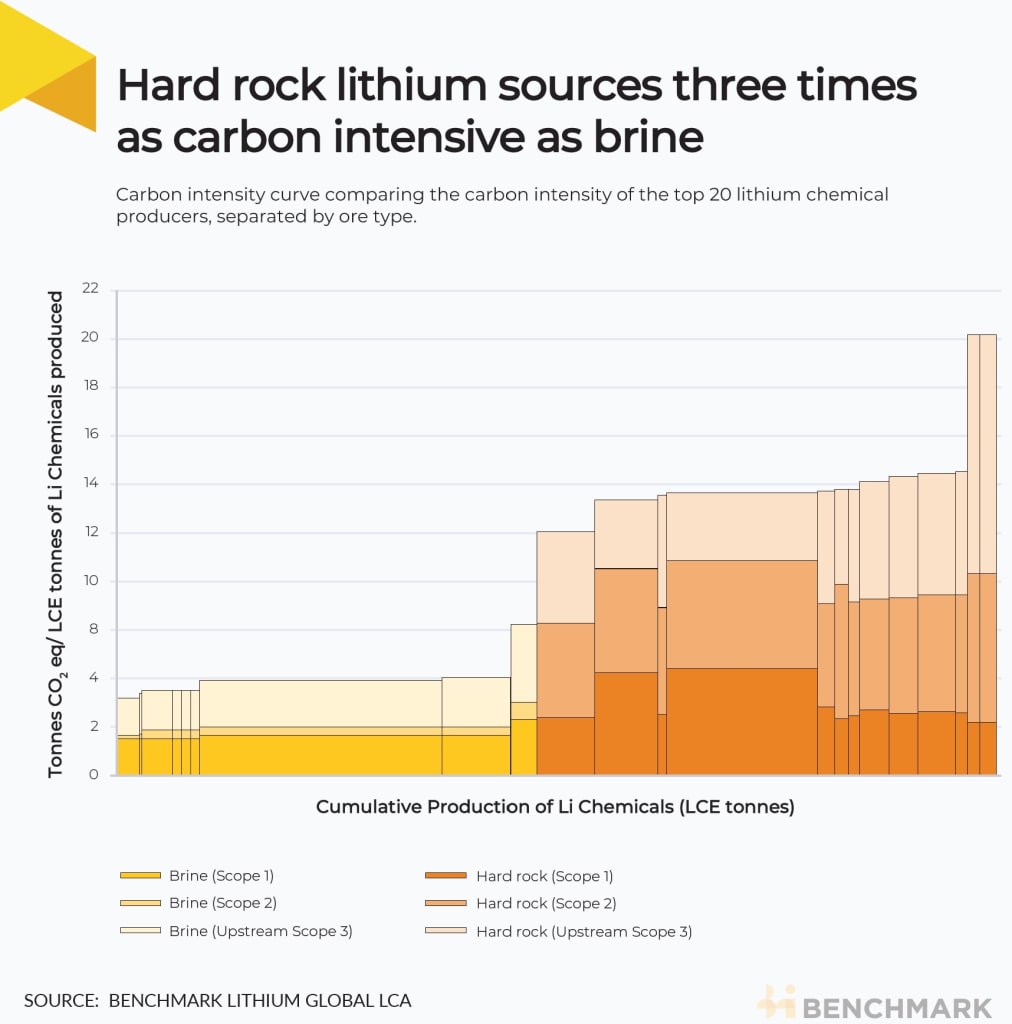
Hard rock lithium vs. brine – how do their carbon curves compare?

Lithium chemicals derived from hard rock sources such as spodumene can be over three times as carbon-intensive as that from brine sources, according to Benchmark’s Lithium ESG Report.
Hard rock sources of lithium currently make up 60% of global mined lithium supply and are forecast to continue to do so through to 2030, according to Benchmark’s Lithium Forecast.
The top 20lithium chemical producerswho use hard rock sources all have higher carbon emissions than those using brine sources, as shown in Benchmark’s new lithium carbon intensity curve.
“Processing hard rock is a much more energy-intensive process than brine,” Olivia Lin, an analyst at Benchmark, said.
Carbon intensity
Thecarbon intensity of the electricity gridswhere the raw material is mined and concentrated and where the lithium chemical is produced strongly impacts the overall carbon intensity of the process.
The majority of spodumene is mined in Australia where it is processed into spodumene concentrate. This concentrate is then shipped to China where it is processed into lithium hydroxide.
Over half of the emissions associated with producing lithium hydroxide from spodumene come from China’s electricity grid (27%) or from the energy-intensive production of spodumene concentrate (29%). Both the Australian and theChinese electricity gridsare highly dependent on fossil fuels with a large amount of coal power.
For lithium carbonate produced from brine sources, only 6% of the carbon emissions are associated with the Chilean electricity grid. The largest single contributor to the carbon emissions is the production of soda ash (29%) used to precipitate out lithium carbonate from the brine solution.
More than just carbon
Benchmark’s life cycle assessmentconsiders more than just the carbon intensity of the process, however.
Processing hard rock lithium sources is more water-intensive than that of brines.
“Even though brine-based producers encounter media pressures surrounding water consumption, it is clear that, based on life cycle assessment (LCA) analysis for processing needs, water use, and impact, are higher for spodumene,” according to Benchmark’s Lithium ESG Report.

In almost every metric, lithium chemicals from hard rock sources are more environmentally damaging than those from brine sources.
Benchmark’s LCA finds that the production of the chemicals used in the extraction and conversion processes for both brine and hard rock sources are major contributors to many environmental metrics.
The soda ash needed in brine processing, for example, is the most significant contributor to many impact categories assessed by Benchmark’s LCA. Similarly, the sulphuric acid needed in lithium hydroxide production from spodumene contributes 56% towards the ecotoxicity of the process and 39% to human toxicity.
“Both brine and spodumene have serious burdens and risks that need to be mitigated in order to reduce overall environmental burden,” Benchmark’s report finds.
Future sources
Currently, hard rock sources of lithium account for 60% of theglobal supply of mined lithium. In part, this is a consequence of geography and geology.
Although lithium chemicals from brine sources are better across the board environmentally, there are strong limitations on where such projects can be developed.
“There is actually a limited geographical location in which you can develop a traditional brine project with the right temperature, evaporation rate, and precipitation rate,”Cameron Perks, an analyst at Benchmark, said. “You’re looking at a year or two just to evaporate your first product.”
Direct lithium extraction (DLE) is a new technology being developed to more efficiently extract lithium from brine sources. Benchmark’s Lithium Forecast suggest the deployment of DLE will encroach on the market share of traditional brine sources over the coming decade and reach over 16% of the total mined lithium market share.
“DLE has a good chance of being a significant component of supply by 2030,” according to Perks.

However, given the nascent state of DLE technologies, the environmental credentials compared to traditional brine sources are not currently assessed by Benchmark.
“Employing DLE does not necessarily mean that the whole production is cleaner given the variations in DLE methods and project designs, which bring about uncertainties in its environmental impact such as the actual energy and water usage,” Lin said. “It is therefore important to carry out LCAs for DLE too for a fairer and more accurate comparison with the conventional evaporitic technology.”
Importance of Life Cycle Assessments
Life cycle assessments form a vital component of a company’s overall environmental, social and governance (ESG) reporting. They can be carried out at a company level or be more granular and focus on individual processes.
“LCAs are used to identify environmental risks so you can mitigate them in the future,” Bruna Grossl, an LCA practitioner at Benchmark, said in avideo for Benchmark Source.
An LCA takes into account not only the impacts directly associated with a project, but Scope 2 and Scope 3 impacts as well.
For example, Scope 2 accounts for electricity purchased by a converter from the grid of the country they are operating in. If a country has a highly fossil-dependent grid, Scope 2 emissions can be significant. Scope 3 accounts for the production of the chemical reagents required by the processes (such as sulphuric acid and soda ash) as well as transportation.
Benchmark’s Lithium ESG Report found that although the top five miners and the top five converters all produce publicly available ESG reports, only a third of all operating lithium miners and converters do. This highlights a major lack of transparency in the industry.
“Disclosure of numbers is something that we see as a critical thing to be improved,” Grossl said. “Transparency is key.”
Benchmark’s Lithium ESG Report provides an independent and detailed assessment of the ESG performance and approach of more than 250 lithium producers worldwide.
Our Lithium ESG Report is part of our suite of services analysing sustainability issues in the lithium ion battery supply chain, along with our Cobalt and Nickel ESG Reports and our Life Cycle Assessment (LCA) work.
If you’d like to see more information about our ESG analysis services, please provide your details here and our team will contact you to discuss further.
And join us on Thursday 23 March for our ESG webinar –Sustainability of the Lithium Ion Battery Supply Chain.
 >
>  >
>  >
>  >
>  >
>  >
>  >
>  >
>